Overview
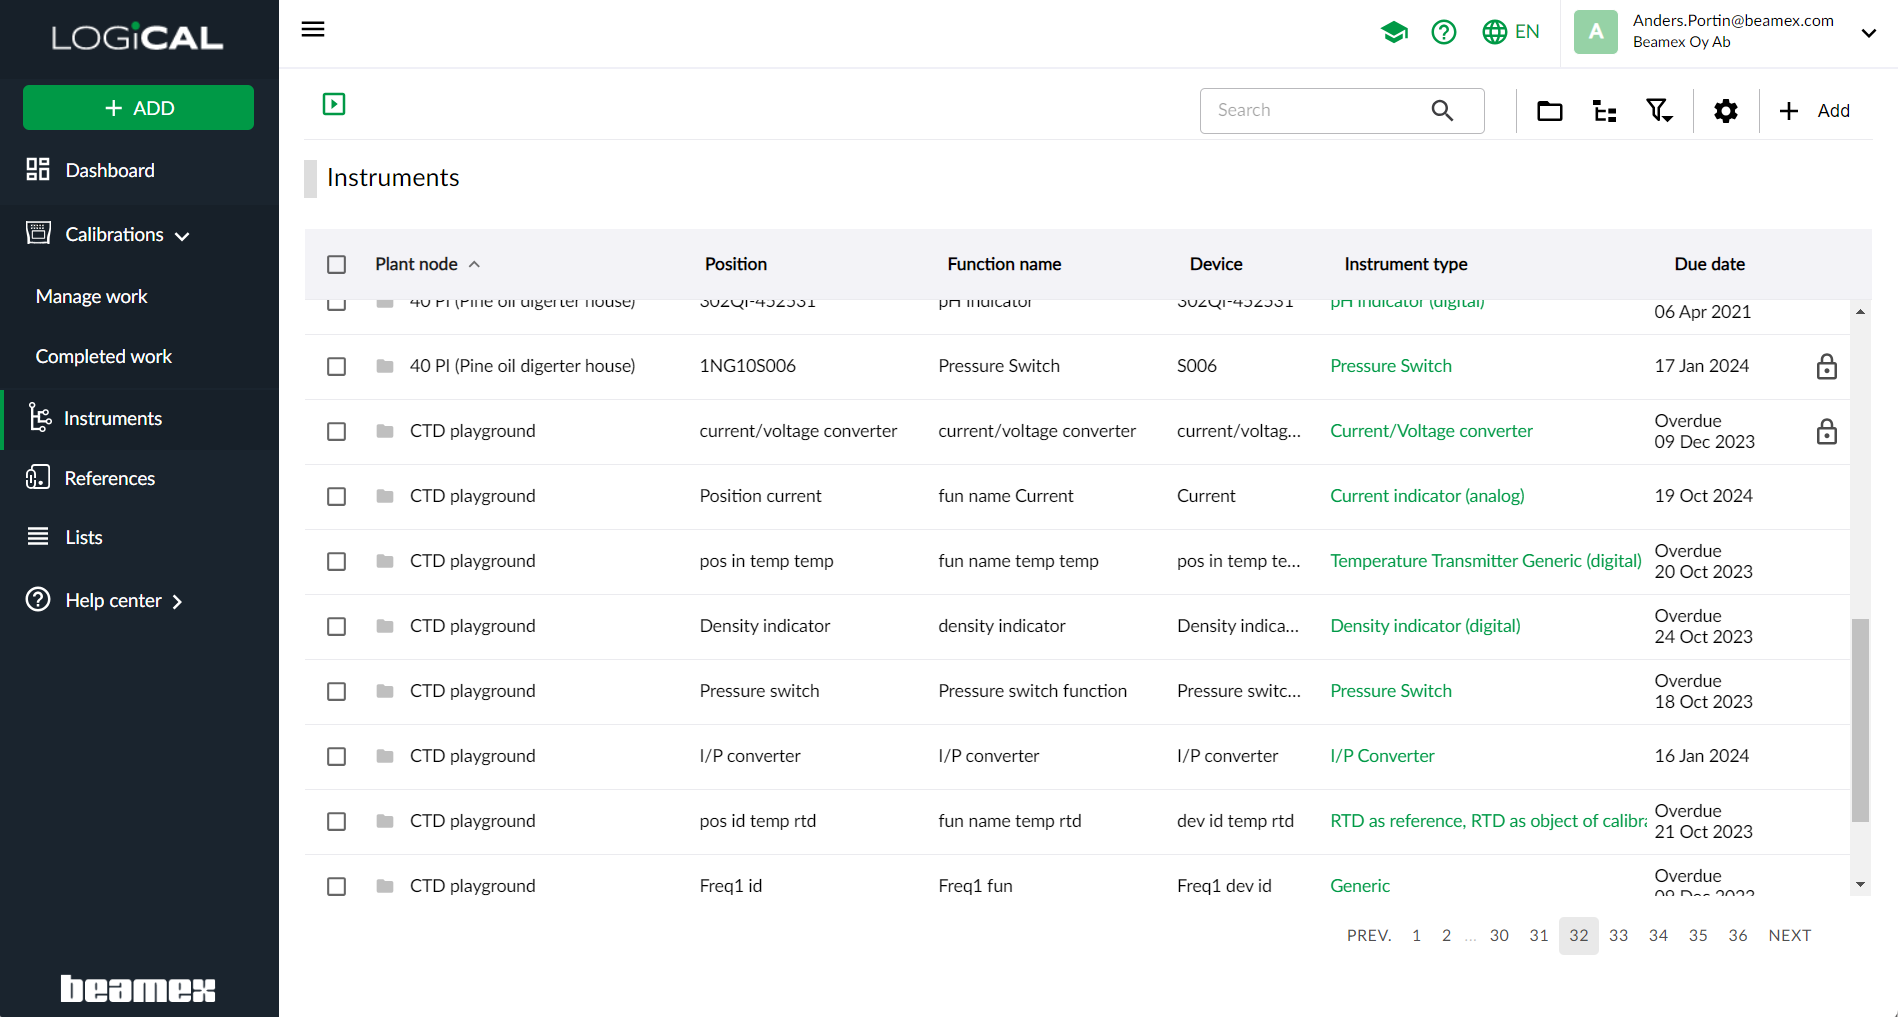
Instruments view for maintaining your instruments.

Clicking a link in the instrument type column will open the calibration methods calibration methods dialog on the right. The user will also be automatically transferred to the instrument types list.
The instrument management view consists of following sections:
Toolbar
Always accessible tools
| Button | Function | Description |
|---|---|---|
| Tour | Start the tour presenting available functionality in the view. | |
| Activate explorer view. | Toggle between explorer view and flat list view. | |
| Activate flat list view. | Toggle between explorer view and flat list view. | |
| Tree | Toggle plant structure tree view visibility. | |
| Filter | Filter what is shown in the list view. The alternatives are :
| |
| Column configurator | Column configurator for choosing which columns to be visible in the view. | |
| Add | Add a plant node, instrument or free device. |
Tools visible based on selection
These tools are visible only when one or more plant nodes or instruments are selected. Only buttons related to the currently selected items are shown. These buttons are shown to the left of the always accessible tools.
| Button | Function | Description |
|---|---|---|
| Remove | Removing selected item from LOGiCAL | |
| Edit | Opens the selected item in the edit view | |
| Assign | Assigning an instrument for calibration. | |
| Unassign | Unassign an instrument that has previously been put into assigned state. | |
| Export all | If you want to export all instruments for a certain plant node. This can be done by changing the list view to flatlist and then clicking the Plant structure button in the menu. Select the desired plant node from the visible plant structure and click the Export all button in the menu. |
Tree view
Plant structure allows you to create your plant's hierarchical structure to make it easy to navigate within LOGiCAL. Instruments can be added to any existing plant structure level (instruments can not be created to the root).
Creating a plant structure is optional, but if you create one, it is recommended to create it before you start adding instruments. Then, while adding instruments you are able to select the plant structure from the drop-down menu.
Site-based access control can be used to limit individual users’ access to specific sites only (first plant structure level)
For navigation in the tree view use the icons on left side next to the item text. Clicking the text will show the instruments or plant nodes for the current position in the tree view.
List view
Instruments and plant nodes show up in this list view. You can have it two ways: explorer or flat list. Sort rows to your preference by clicking the table header and right-click over row to open a context menu.
- In explorer mode, you may browse the plant structure like using a file explorer. Double clicking a row with folder symbol moves you deeper in the plant structure.
- The flat list mode. Consider having a complex plant structure, i.e. “Factory” with many child nodes and instruments. You’d like to see all instruments that belong to “Factory” at once. To do that, just have the flat list mode active and click the “Factory” plant node!
Filter
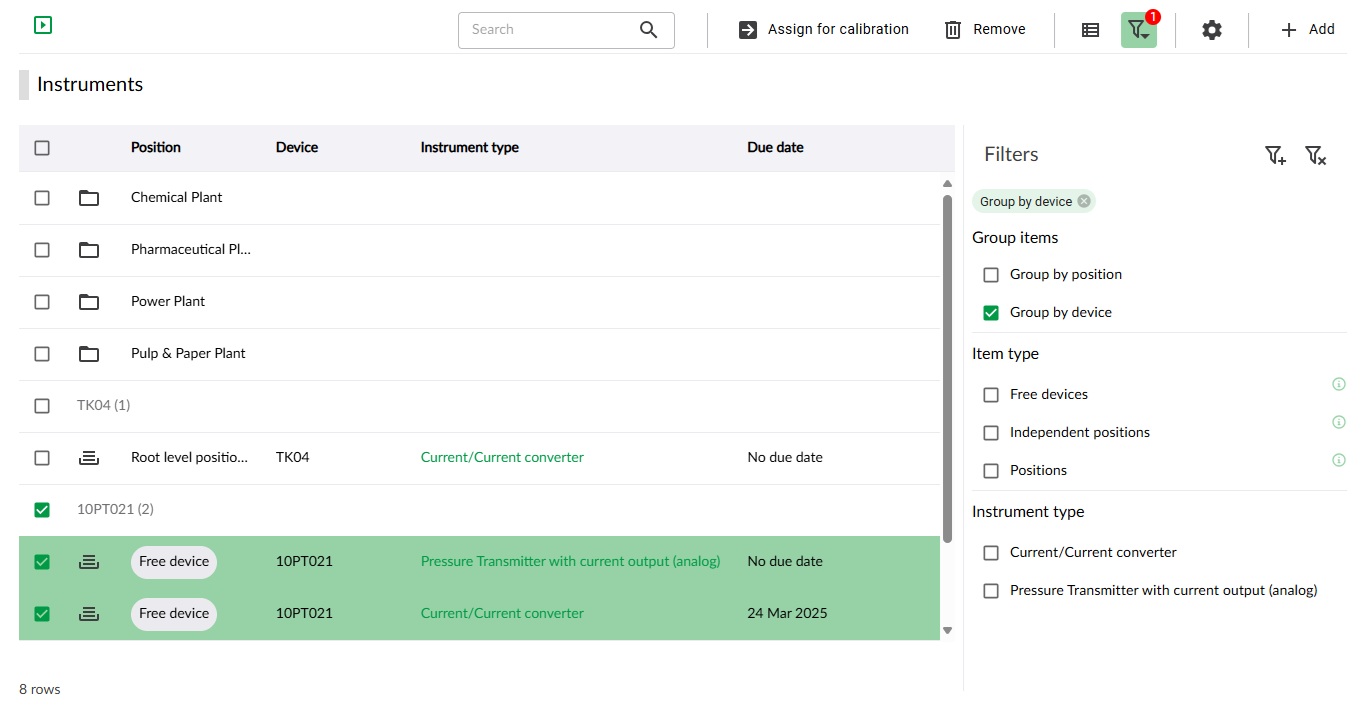
Instruments and calibrations can be filtered on state, due date, position, instrument type etc. depending on where they are used. By clicking the filter button in the navigation the right side bar opens and provides the filtering types available for the current view.
Note! Grouping by instrument position or device is only available in the explorer mode.
Active filters are presented as tags at the top and the amount of active filter is also shown on the filter icon.

As default, all instruments, regarding position and type, are visible in the list.
Note!
Filters stay active when navigating through the instrument path!
To ensure no filters are active use the Clear filters button.
Search

Use the global search field at the top of the page for searching and filtering your instruments. When the search field is used a tag with the searched string is created in the filters. The tag can be combined with other filters to narrow down the search results. It is also possible to use a more advanced search.
Advanced search
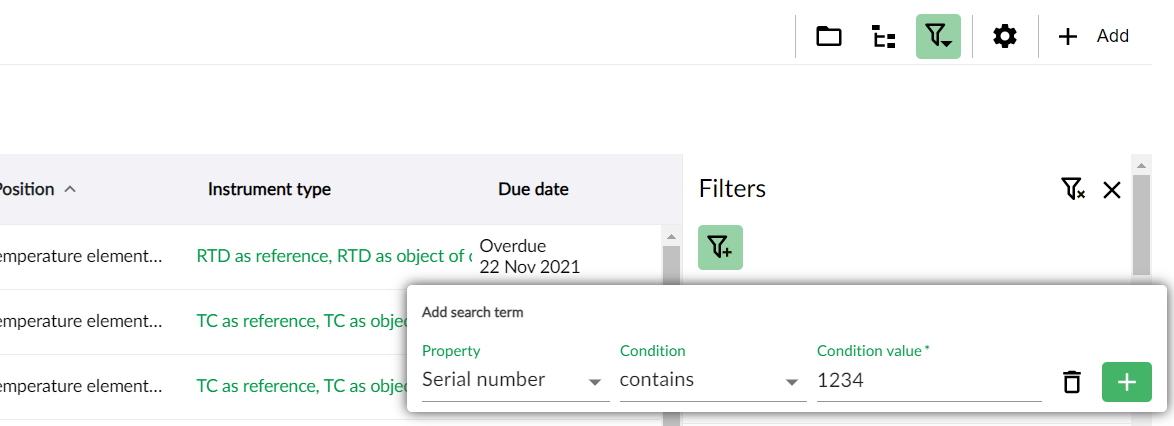
By pressing the filter icon with a plus-sign, it is possible to do a more specific search on the available fields. The search terms are added as tags with a property, condition and desired value. It is possible to add several search terms to the tag list.

Context menu
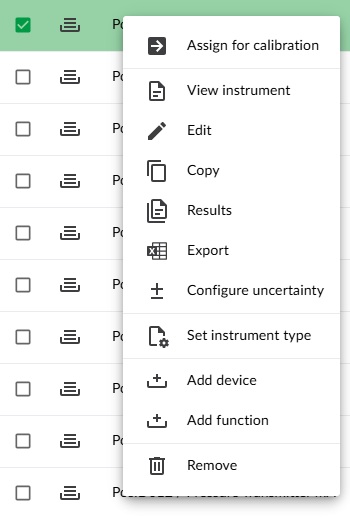
For every row in the instrument view, there is a context menu for easy access to available functionality. By right clicking on an item row, the context menu becomes visible to the user.

The context menu contains actions:
Assign for calibration, Unassign, View instrument, Edit, Results, Export, Configure uncertainty, Set instrument type, Add device, Add function and Remove.